Honeycomb Layer
Honeycomb layers aggregate and visualize data using the H3 geospatial indexing system. This layer type is particularly useful for showing the density of points and identifying patterns, especially if there are a large number of underlying points.
Configuration Options
H3 Data
Configure how H3 geospatial data is processed and displayed:
H3 Field
The field containing H3 geospatial indexes for your data points. Honeycomb supports both hexadecimal string h3 indexes (8a283082a677fff) and integer H3 indexes (622203769624952831).
If your data contains latitude and longitude columns that Honeycomb can detect, Honeycomb will create an h3 field in your data automatically. This means that your data source does not need to contain H3 indexes in order to visualize it with a Honeycomb layer.
Resolution Mode
Control how H3 indexes are processed and displayed on the map:
- Auto (Default): The H3 resolution adjusts automatically based on the current zoom level
- Fixed: Use a specific H3 resolution level (0-15):
- 0-2: Continental scale (~1000km)
- 3-5: Regional scale (~100km)
- 6-8: Metropolitan scale (~10km)
- 9-11: City scale (~1km)
- 12-15: Street level (~100m)
- Native: Display H3 indexes exactly as they appear in the source data
Performance Warning
Using high fixed resolutions or native mode with high-resolution H3 indexes can impact performance, especially when zoomed out.
Measure Field
The numeric field containing the values you want to visualize.
Aggregation Type
Choose how to combine multiple values that fall within the same hexagon:
- Minimum: Use the smallest value
- Maximum: Use the largest value
- Sum: Add up all values
- Average: Calculate the mean
- Median: Calculate the middle value
- Count: Show the number of data points
INFO
Aggregation type is only available for Auto and Fixed resolution modes.
Appearance
Basic visual settings for the layer:
- Opacity: Control the transparency of the hexagons (0-100%)
Tooltip Settings
Configure what information appears when users interact with hexagons:
- Enable Tooltips: Toggle whether tooltips appear on hover
Tooltip Fields (Native Resolution Mode)
When using Native resolution mode, you can configure which fields from your data appear in tooltips:
- Select one or more fields to display
- Fields are shown exactly as they exist in the underlying data
- No aggregation is performed
Multiple Tooltip Fields with Aggregation (Auto and Fixed Resolution Modes)
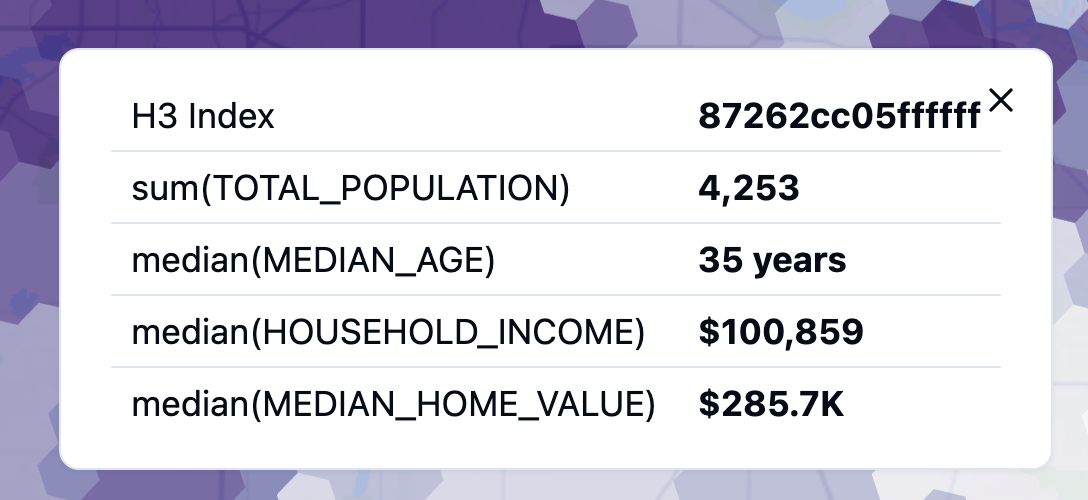
When using Auto or Fixed resolution modes, H3 data is aggregated on-the-fly. You can display multiple fields in tooltips with customizable aggregation:
Field Selection:
- Select multiple fields to include in the tooltip
- Each field can have its own aggregation type
Aggregation Types: For each selected field, choose how values are aggregated within each hexagon:
- Sum: Add up all values
- Average: Calculate the mean value
- Count: Count the number of records
- Minimum: Show the smallest value
- Maximum: Show the largest value
- Median: Show the middle value
Example: For a delivery dataset aggregated to H3 hexagons, you might show:
- Order Count (aggregation: Count)
- Total Revenue (aggregation: Sum)
- Average Delivery Time (aggregation: Average)
This allows each hexagon tooltip to display rich, multi-dimensional information about the aggregated data it represents.
Tooltip Number Formatting
Numeric values displayed in tooltips can be formatted for better readability:
- Apply currency, percentage, or compact formatting to tooltip fields
- Add unit labels (e.g., "mph", "°F", "/day")
- Configure decimal places and thousands separators
For complete details on formatting options, see Number Formatting.
Colors
Control how values are represented through colors:
Color Mode
Choose between static colors or dynamic color schemes:
Static Color:
- All hexagons use a single, fixed color regardless of data values
- Useful for showing geographic coverage or areas without emphasizing values
- Example: Display all H3 cells where service is available in blue
- Configure the color and opacity
Dynamic Color Scheme:
- Colors vary based on data values (metrics or dimensions)
- Supports continuous metrics (using interpolation) or categorical dimensions
- Multiple color palettes and interpolation methods available
Color Scheme Settings (Dynamic Mode)
When using dynamic color schemes, several interpolation types are available:
For Continuous Data (Metrics):
- Value Interpolation: Colors map proportionally to actual data values
- Quantile Interpolation: Data divided into equal-sized groups, each with one color
- Custom Discrete: Define custom value ranges with specific colors for each range
For Categorical Data (Dimensions):
- Select a categorical field (text/string)
- Each unique category automatically receives a distinct color
- Choose from categorical color palettes optimized for visual distinction
Additional Options:
- Color Palette: Select from sequential, diverging, or categorical palettes
- Color Steps: Number of distinct colors (3-9) for continuous schemes
- Reversed: Flip the color order
Custom Discrete Color Interpolation
The Custom Discrete interpolation type allows you to define fixed color ranges that remain constant even as filters change your data:
How it works:
- Define value ranges with start, end, and color for each range
- Values outside all ranges receive a default color
- Ranges are inclusive of start value, exclusive of end value
When to use:
- Time series animations: Keep color meanings consistent when using time slider
- Threshold highlighting: Emphasize specific value thresholds (e.g., performance targets)
- Positive/negative values: Use diverging colors around a breakpoint (e.g., profit/loss around $0)
Example - Sales Performance:
$0 - $10K: Light green
$10K - $50K: Medium green
$50K - $100K: Dark green
$100K+: Darkest green
Default (no sales): Gray
$0 - $10K: Light green
$10K - $50K: Medium green
$50K - $100K: Dark green
$100K+: Darkest green
Default (no sales): GrayWith custom discrete coloring, these ranges stay fixed even when animating through different time periods, making it easy to compare how hexagons move between performance tiers over time.
For complete details on all color scheme options, see Color Schemes Reference.