Line Layer
The Line Layer allows you to display linear features on the map, such as routes, roads, or boundaries. This is useful for visualizing routes, connections, or geographic features represented by lines.
Data Requirements
The Line Layer requires a data source with a column containing line data in one of the following formats:
- GeoJSON LineString
- Well-Known Text (WKT) LineString
- Snowflake's native
GEOGRAPHYdata type
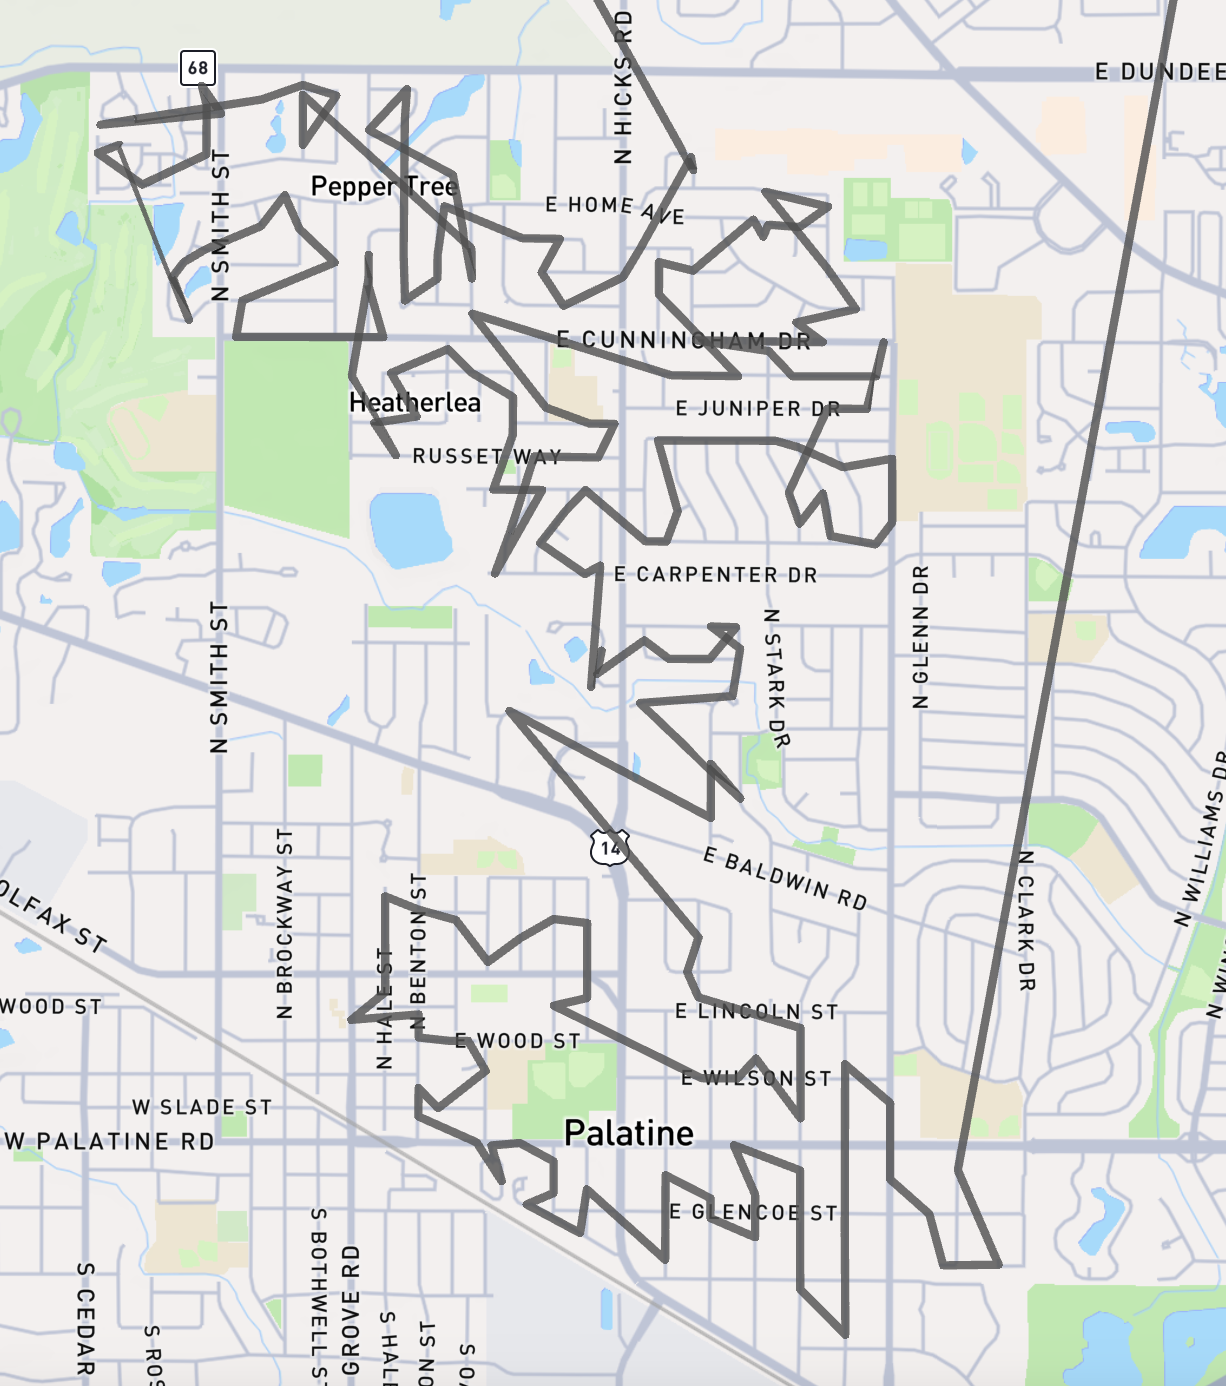
Example
Configuration Options
Basic Properties
- Line Field: The column containing the line data.
- Data Source: The data source to use for the layer.
- Visible: Whether the layer should be visible on the map by default.
- Visible Zoom Range: The zoom levels at which the layer should be visible. This can be used to show detailed line data only when zoomed in.
Appearance
The appearance of the Line Layer can be customized with the following options:
Opacity: The overall opacity of the lines.
Size Mode
- Static: Use a fixed width for all lines.
- Line Width: The width of the lines in meters or pixels.
- Data-Driven: Vary line width based on a data field.
- Size Field: The numeric field to determine line width.
- Scale Factor: Multiplier applied to the size field value.
- Unit Type: Whether the scaled value is in meters or pixels.
- Static: Use a fixed width for all lines.
Minimum Pixels: The minimum width of the lines in pixels. Ensures lines remain visible when zoomed out.
Interaction
- Tooltips: Enables displaying additional information in a tooltip when the user hovers over a line.
- Tooltip Fields: Select which fields to include in the tooltip.
Colors
The color of the lines can be set to a single color, or dynamically based on a color scheme.
Color Mode
- Single Color: Use the same color for all lines.
- Color: The color to use for all lines.
- Color Scheme: Assign colors to lines based on a data field.
- Color Field: The field to base the color on. Can be a categorical or continuous field.
- Color Scheme: Predefined color schemes to choose from.
- Color Steps: The number of color steps in the scheme.
- Reverse Colors: Reverse the order of colors in the scheme.
- Interpolation Type: For continuous color fields, choose between 'Linear' or 'Quantile' interpolation.
- Single Color: Use the same color for all lines.
Color Mapping: For categorical color fields, you can customize the color for each category by clicking on the color square.
Tips
Perfomance is driven by the number of line vertices which are rendered in the current view.
For best performance, simplify complex lines and limit the total number of vertices, especially when using data-driven line width. Consider using the 'Visible Zoom Range' to only show detailed lines when zoomed in.
Adjust the 'Minimum Pixels' setting to ensure lines remain visible when zoomed out.
Choose colors that provide good contrast against the basemap, especially for thin lines.