Polygon Layer
The Polygon Layer allows you to display polygons on the map. This is useful for visualizing areas such as geographical regions (districts, counties, census areas), custom boundaries, or results of geospatial analysis.
Data Requirements
The Polygon Layer requires a data source with a column containing polygon data in one of the following formats:
- GeoJSON
- Well-Known Text (WKT)
- Snowflake's native
GEOMETRYdata type
Example
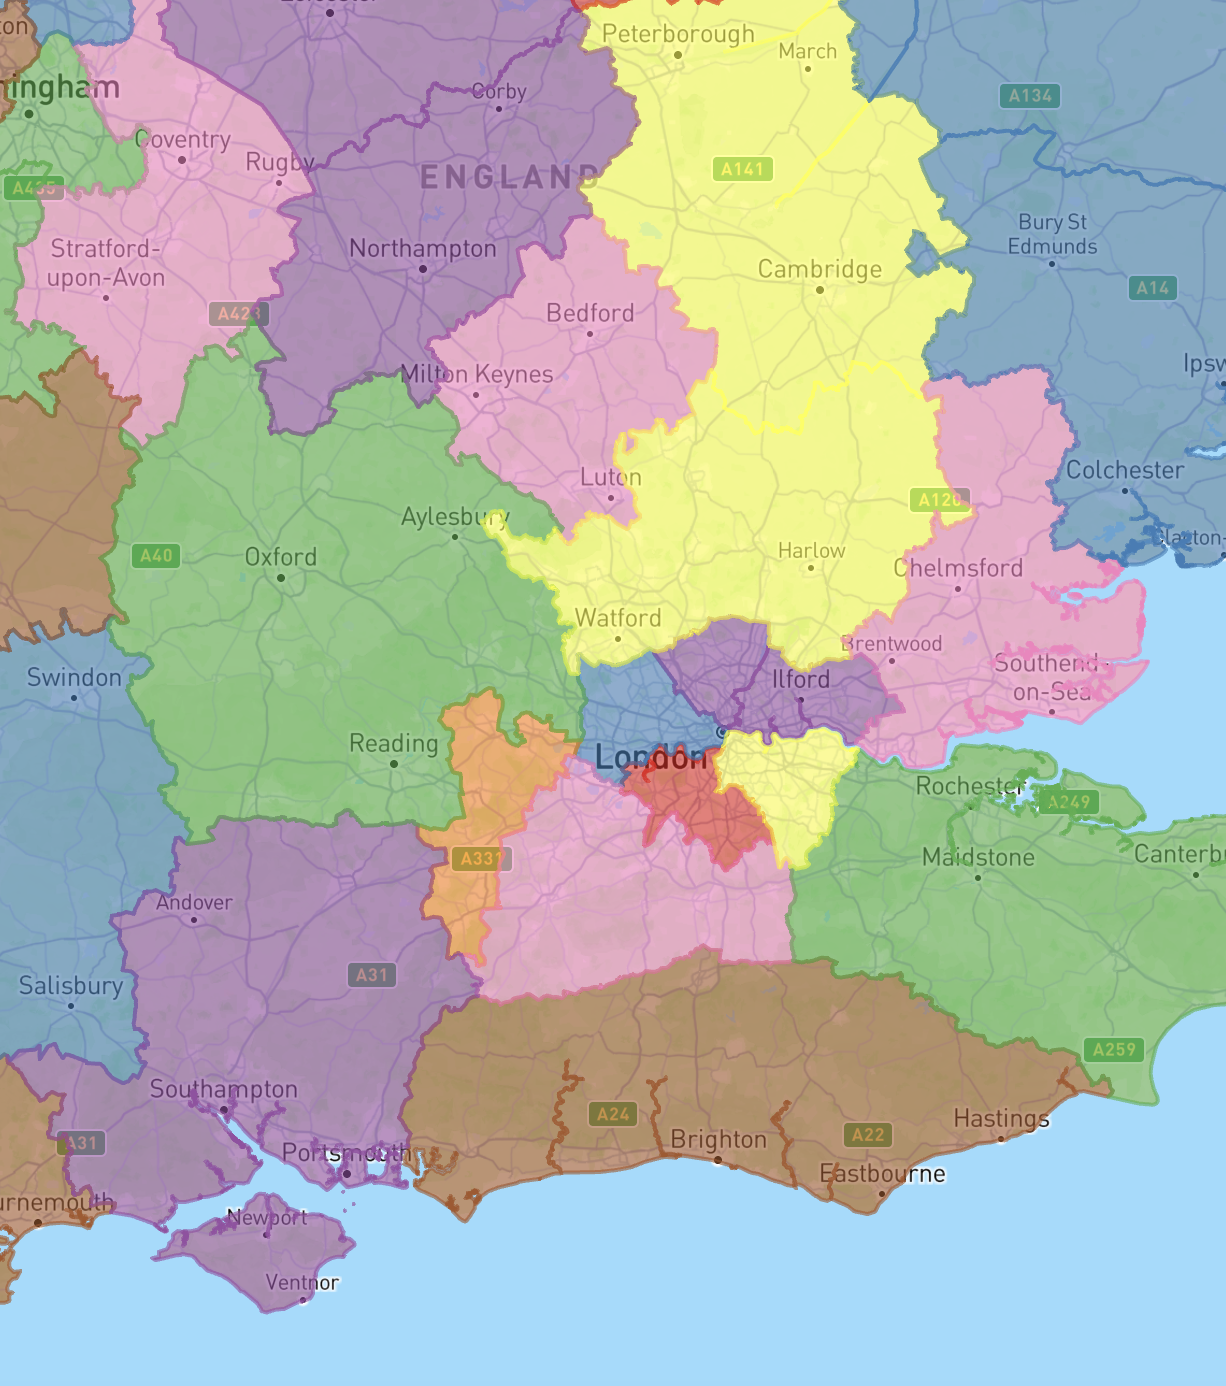
Configuration Options
Basic Properties
- Polygon Field: The column containing the polygon data.
- Data Source: The data source to use for the layer.
- Visible: Whether the layer should be visible on the map by default.
- Visible Zoom Range: The zoom levels at which the layer should be visible. This can be used to show detailed polygon data only when zoomed in.
Appearance
The appearance of the Polygon Layer can be customized with the following options:
Fill Settings
- Enable Fill: Whether to fill the polygons with a color.
- Fill Opacity: The opacity of the polygon fill color.
Outline Settings
- Enable Outline: Whether to draw an outline around the polygons.
- Outline Width: The width of the outline in meters.
- Minimum Outline Width: The minimum width of the outline in pixels. This ensures the outline remains visible when zoomed out.
- Outline Opacity: The opacity of the outline.
- Separate Outline Color: Whether to use a separate color for the outline. If disabled, the fill color will be used.
- Outline Color: The color to use for the outline, if 'Separate Outline Color' is enabled. Only a static color is supported.
Interaction
- Tooltips: Enables displaying additional information in a tooltip when the user hovers over a polygon.
- Tooltip Fields: Select which fields to include in the tooltip.
- Tooltip Number Formatting: Numeric values displayed in tooltips can be formatted for better readability. Apply currency, percentage, or compact formatting, add unit labels, and configure decimal places. See Number Formatting for details.
Colors
The color of the polygons can be set to a single color, or dynamically based on a color scheme.
Color Mode
- Single Color: Use the same color for all polygons.
- Color: The color to use for all polygons.
- Color Scheme: Assign colors to polygons based on a data field.
- Color Field: The field to base the color on. Can be a categorical or continuous field.
- Color Scheme: Predefined color schemes to choose from.
- Interpolation Type: For continuous color fields, choose how to distribute colors across your data:
- Value: Colors are distributed evenly across the full range of values
- Quantile: Values are bucketed into equal size groups, then each group is assigned a color
- Custom Discrete: Define your own value ranges and assign specific colors to each range
- Color Steps: The number of color steps in the scheme. Must be between 3 and 9.
- Reverse Colors: Reverse the order of colors in the scheme.
- Single Color: Use the same color for all polygons.
Color Mapping: For categorical color fields, you can customize the color for each category by clicking on the color square.
For detailed information about color schemes, including available palettes and configuration options, see the Color Schemes documentation.
Tips
Perfomance is driven by the number of polygon vertices (corner points) which are rendered in the current view.
For best performance, consider simplifying complex polygons in the data pipeline before using them in Honeycomb to improve rendering speed. The Snowflake function ST_SIMPLIFY can be used for this.
Choose colors that ensure the map is readable. Avoid using colors that are too similar to the basemap.