Release Notes
We are continually working to improve Honeycomb. This page contains a list of changes and updates to the app over time, in reverse-chronological order.
Honeycomb updates are rolled out to Snowflake Native App customers automatically, and there is no action users need to take to upgrade to the latest version.
If you encounter a bug or unexpected behavior while using Honeycomb, or want to disclose a security vulnerability, please reach out to support@honeycombmaps.com.
Release 05.01.2025
- Information about the area/polygon that each data point (or H3 index) is located within can now optionally be included when downloading data. This on-the-fly point-in-polygon analysis is very useful for downstream analysis, such as pivot tables.
- The advanced polygon filter introduced with the
04.07.2025release now supports selecting from a dropdown list of up to 5000 polygons from another data source. - H3 cells with
nullvalues are not displayed on the map, useful for sparse datasets with multiple metric columns. - Arc layers support continuous color schemes
- Misc bug fixes
- The SQL editor now fully supports dark mode
- Resolves an issue that presented legend values from displaying correctly for arc and line layers
Release 04.07.2025
- A new advanced polygon filter
- Polygons from one data source (for example, 'US County Boundaries') can now be used to filter other layers and metrics on-the-fly.
- Multiple polygons can be used as a filter simultaneously
- Polygons filters from a data source can be edited, with filtered results displayed in real-time
- Exact polygon filtering rather than approximation
- Ability to choose exactly which data layers and metrics the polygon filter should apply to
- Map creators can choose whether users can draw polygons, upload them from GeoJSON files, or select polygons from other layers as a filter
- Maps can now be saved with or without filters applied.
- Raw data can be downloaded for H3 (Honeycomb) layers
This release contains patent-pending features.
Release 03.11.2025
Main focus: High performance polygons Honeycomb can now handle over 10x the number of polygons that was previosly possible, while still ensuring smooth rendering. This is very useful for showing many no-parking zones for scooter providers, for example, or for restaurants to visualized delivery isochrones from different locations.
This is accomplished through a new data processing and rendering method. In addition, small bugs related to coloring polygon layers and showing legend key values were resolved.
Release 03.01.2025
This release contains small tweaks to filtering and data downloads:
- H3 columns are now downloaded in hexadecimal format (eg.
8c275268836d3ff) rather than integer format. - Resolves a bug affecting filtering layers which are colored by a boolean field.
Release 02.13.2025
This release is focused on performance. It implements smart batching and compression between Snowflake and the browser, allowing for parallelized data transfer. This has the potential to make loading datasets from Snowflake more than 500% faster.
Batches and compression also increase reliability on poor internet connections.
In addition, the Legend component has been modified to show the loading progress of the data source behind each map layer, giving users increased transparency into how different conditions impact load times. In addition, map layers which have been successfully loaded can be used immediately.
Release 02.07.2025
This release contains minor improvements and bug fixes
- The SQL editor is now pre-populated with the query for the current data source
- The state of collapsed/open legend keys is now saved when a map is saved. Collapsing legend keys by default can help save space on complex map dashboards that have many categorical data sources.
Release 01.28.2025
This release improves the efficiency of loading very large datasets.
Release 01.15.2025
Data Download
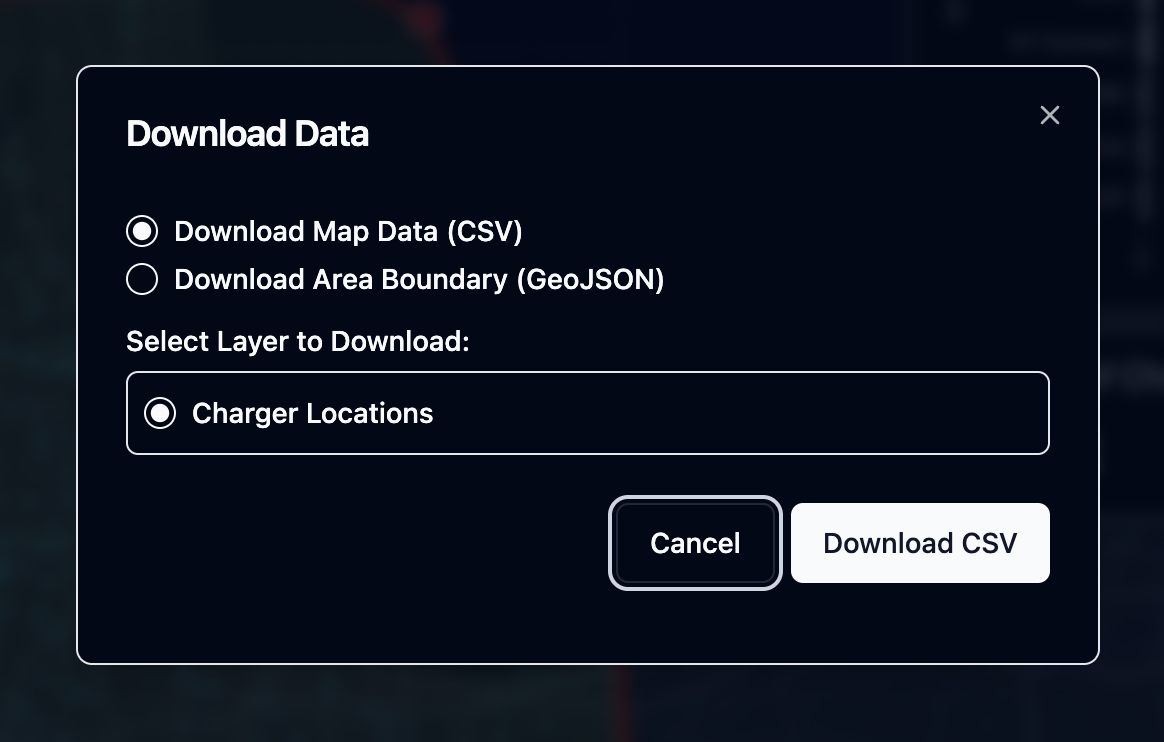
Map data can now be downloaded to CSV files. To download data, add a polygon card to the map, then select an area of interest, and click 'Download Data' in the polygon card. Next, select a map layer to download data from. Initially, only data from point layers can be downloaded to CSV. The boundary of the selected filter area can also be downloaded as a GeoJSON file.
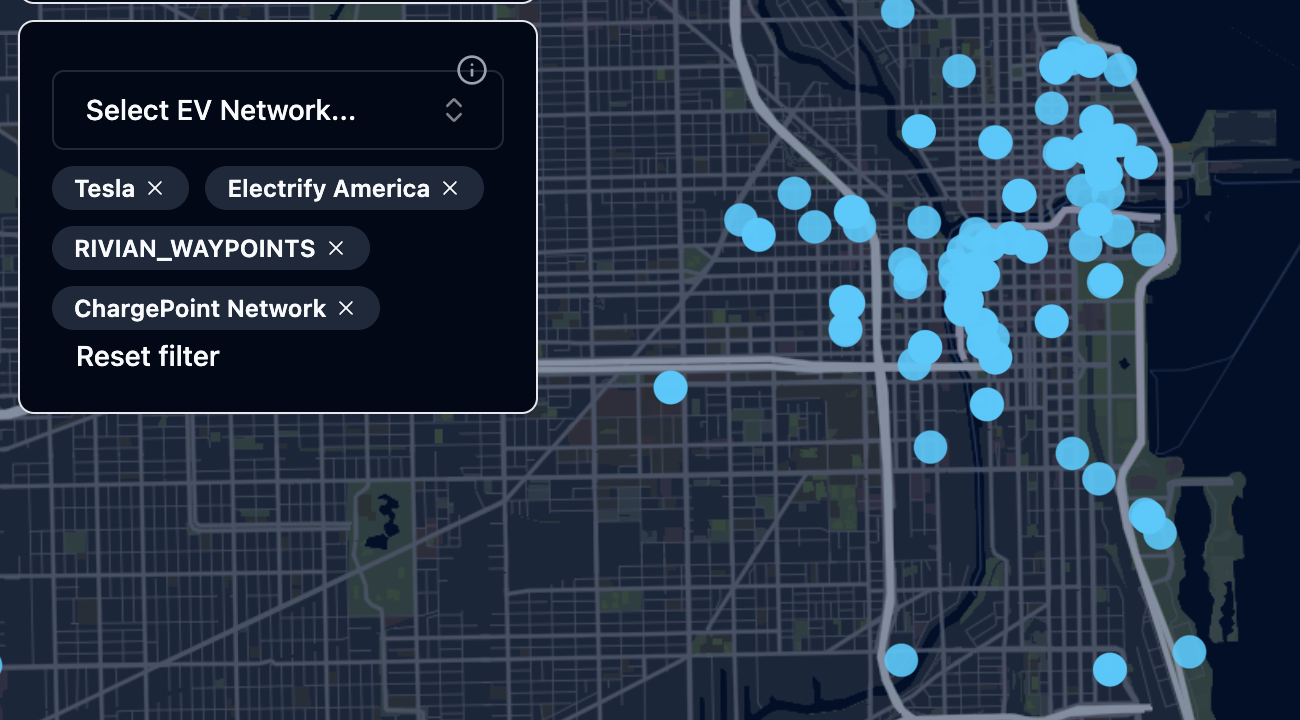
Dropdown filters & other components optimized for size
The dropdown filter has been redesigned to take up signficantly less vertical space, allowing for many filters to be added to a map. Other components, including the big number card and title card, have been optimized to save space and enable more powerful interactive maps.
Additional updates
- Color scales for the legend can now be collapsed, useful for saving space on the legend when the map has categorical fields with many unique values where the specific color doesn't matter
- The 'save' button has been enhanced to confirm whether the save was successful after it is clicked
- A bug causing missing labels for boolean fields in filters has been resolved
- A bug affecting categorical color schemes for arc layers has been resolved
Release 01.08.2025
Enhanced data component filtering
Filters can now affect data components (Big Number, Bar Chart, Histogram), in addition to layers. Each filter can be customized to affect a specific set of different layers and components, allowing for the creation of powerful interactive experiences for different types of data and analysis.
Adding median as an aggregation type
MEDIAN is now supported as an aggregation type, adding to the existing types (SUM, COUNT, MIN, MAX, AVERAGE)
Additional updates
- Autosave is now enabled by default when editing a saved map
- A bug related to 'stranded' filters which occured when filtering the data with a data component and then removing the data component has now been resolved. To filter a data component, use a filter component, rather than interacting with the data component. This has the added benefit of being able to save a map with a certain set of filters enabled.
Release 12.19.2024
Filter Component
This update adds support for a new filter component, which gives users the power to refine the data directly. For example, with a map of different points-of-interest (POIs), the user could select 'Restaurants' to only show a subset of POIs on the map.
The following types of filters are supported:
Categorical:
- Dropdown w/ search
- Radio Buttons
- Option Toggle
for each categorical filter, both single and multi-select are supported
Continuous:
- Range Slider
- Single Value Slider
The field to filter, the type of filter, and the map layers the filter will apply to can be configured from the 'Components' menu in the sidebar. Users of the map can then customize filter values, even if the map is in read-only mode.
Active filters that exist when the map is saved will be persisted on the saved map.
Autosave
When a saved map is loaded, autosave can be turned on in the 'Save and Share' menu. Autosave will automatically save changes to maps as you work, preventing you from losing work if you forget to save.
The 'Save and Share' menu has also been redesigned to highlight the current map. New buttons allow for easily copying read-only and editable map links.
More color palettes
Three new color palettes have been added, specifically optimized for categorical fields with high cardinality (lots of different values).
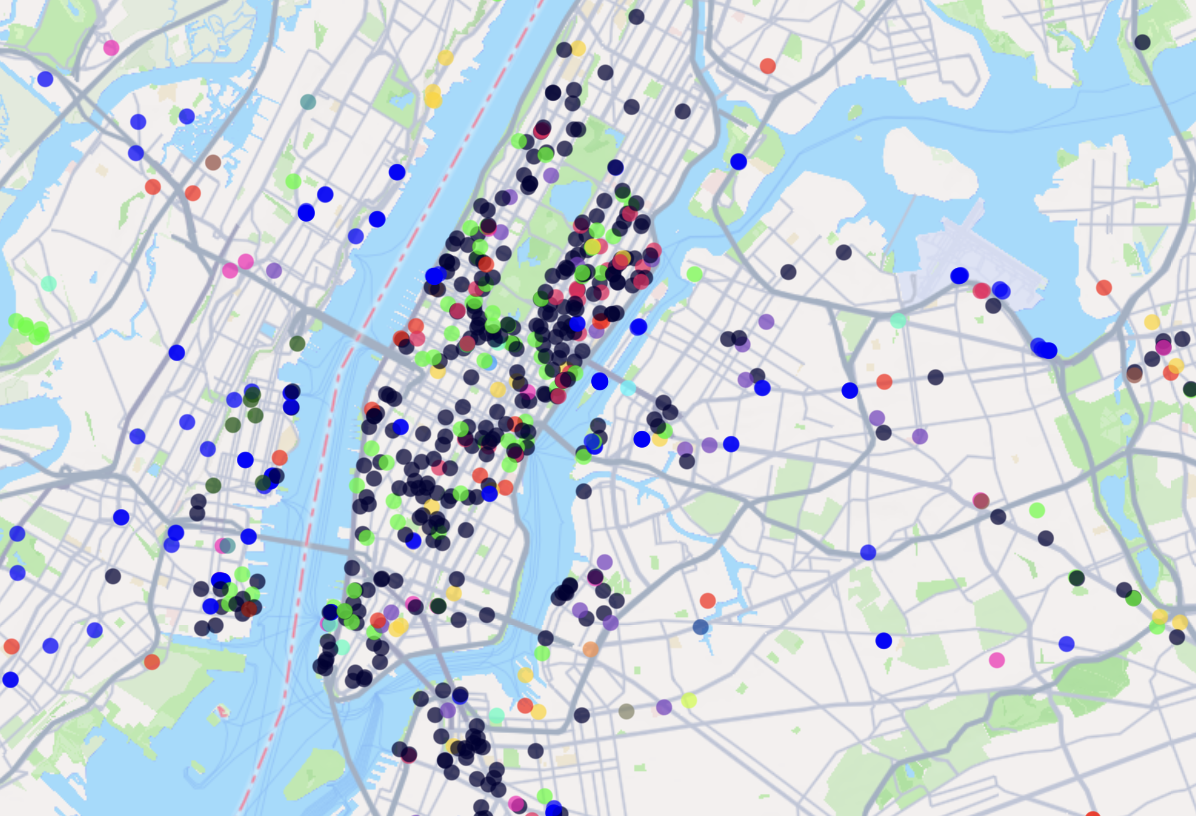
These palettes are Glasbey, GreenArmytage, and Kelly. Each palette is based on influential research papers in color theory and visualization:
_Glasbey, C., van der Heijden, G., Toh, V.F.K. and Gray, A. (2007), Colour displays for categorical images. Color Res. Appl., 32: 304-309. https://doi.org/10.1002/col.20327_
Green‐Armytage, Paul. (2010). A Colour Alphabet and the Limits of Colour Coding. Color: Design & Creativity. 5. 1-23.
Kelly, Kenneth L. "A Universal Color Language." Color Engineering, vol. III, no. 2, March-April 1965, pp. CE/3-CE/7. Kinelow Publishing Company, Inc.
Clickable tooltips & URL support
Tooltips can be clicked to lock them onto the screen. Tooltips also support clickable links for columns that contain valid URLs.
Re-order layers from the legend
Layers can be dragged and dropped to re-order them, directly from the legend component. This gives users greater control over their map view.
Optimizations for smaller laptops
Components are now slightly smaller, freeing up space for the map to take center stage. This is especially helpful for users on devices with smaller screens, specifically 13" laptops.
Release 12.12.2024
More powerful H3 layers
Honeycomb (H3) layers now support 3 different resolution modes:
- Auto: the resolution adjusts in real-time based on the current zoom level
- Fixed: the resolution is set to a fixed number
- Native: no transformations are made, and the underlying H3 data is passed through directly
Honeycomb supports H3 columns in both hex format and as integers, at any resolution.
Control which layers are displayed at different zoom levels
Layers can now be displayed based on the current zoom level. For example, detailed point or fixed resolution H3 data can be shown only when the user zooms in to the city level. This can also help accelerate performance for demanding visualizations.
Release 12.05.2024
This release adds two new layer types: lines and arcs.
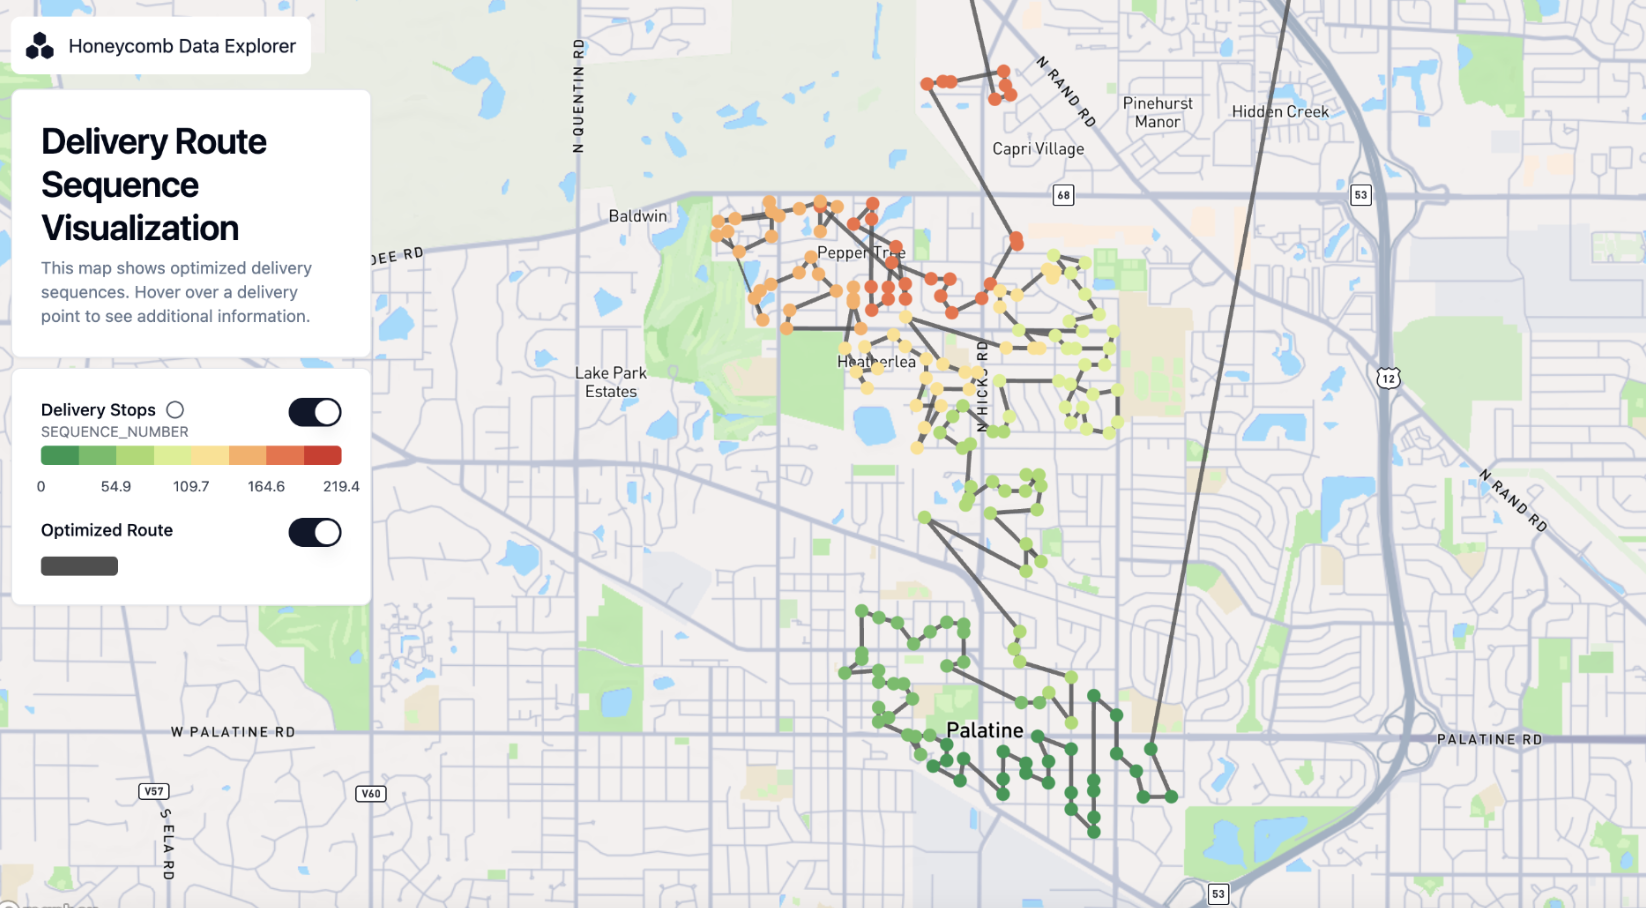
Line Layer
The new line layer unlocks use cases in routing and mobility, such as displaying delivery routes or road infrastruture. Similar to the polygon layer, data can be imported as GeoJSON or WKT. Snowflake GEOMETRY columns are supported natively.
The width and color of lines can be styled dynamically based on other data columns. Lines also support tooltips.
Arc Layer
The new arc layer is designed for showing connections and flows between two points, for example flight connections. The arc layer accepts two pairs of latitude/longitude coordinates - one for origin and one for destination.
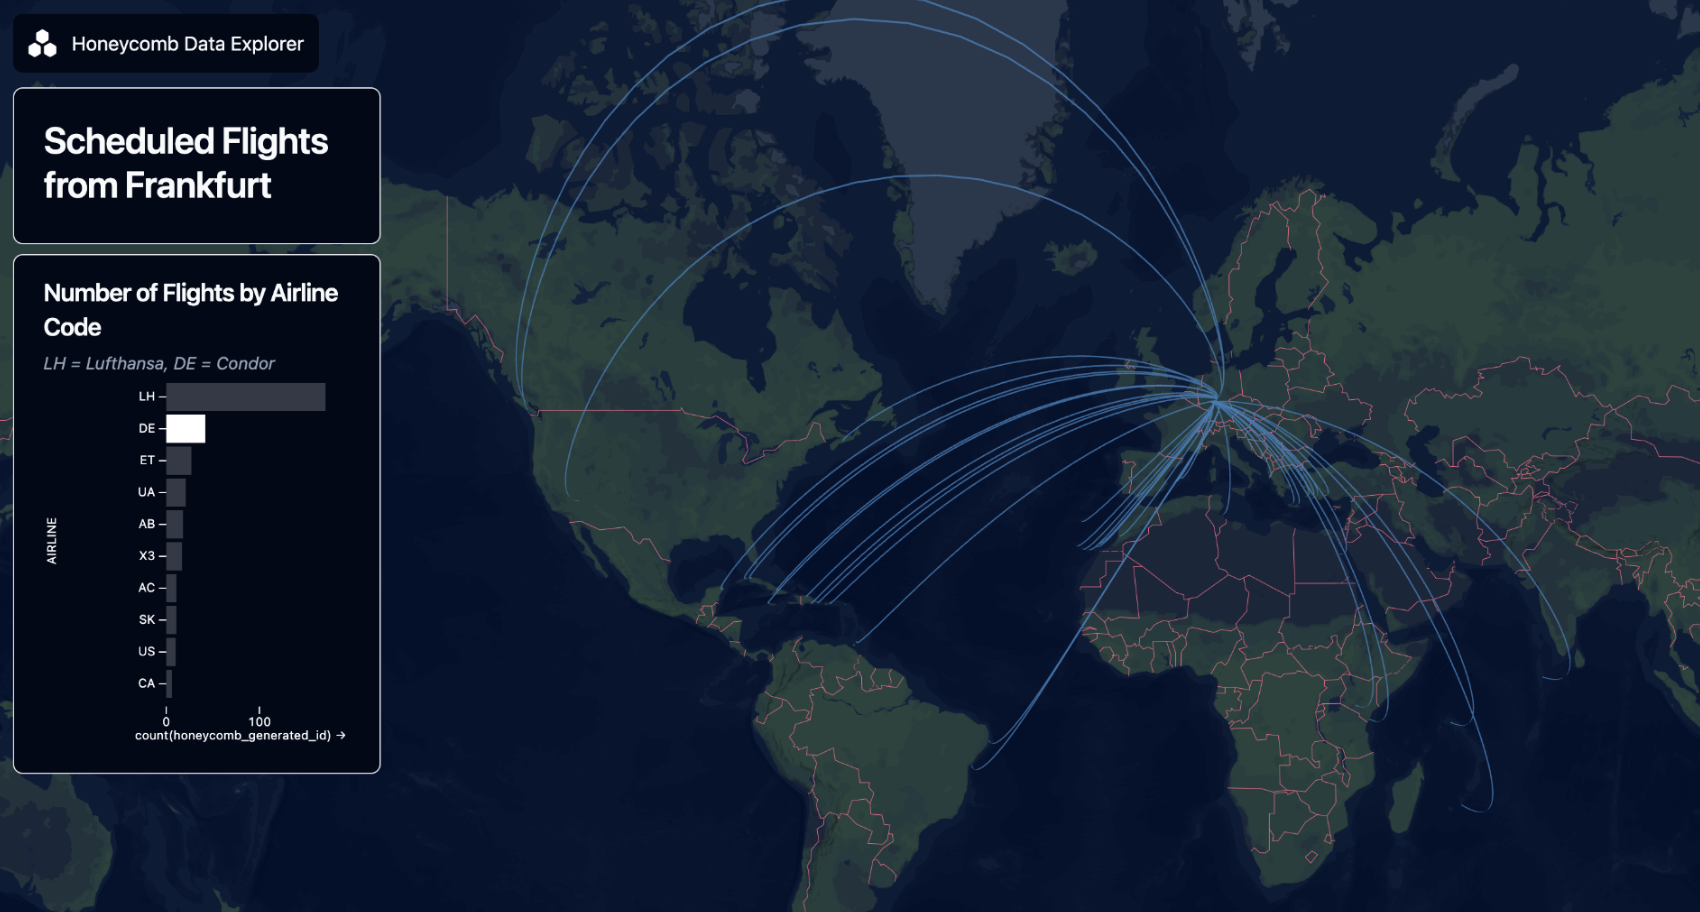
Just like the line layer, arcs can be styled dynamically based on other data columns and support tooltips.
Other improvements
- The outlines of polygons can now have a separate color from the polygon fill
Release 11.27.2024
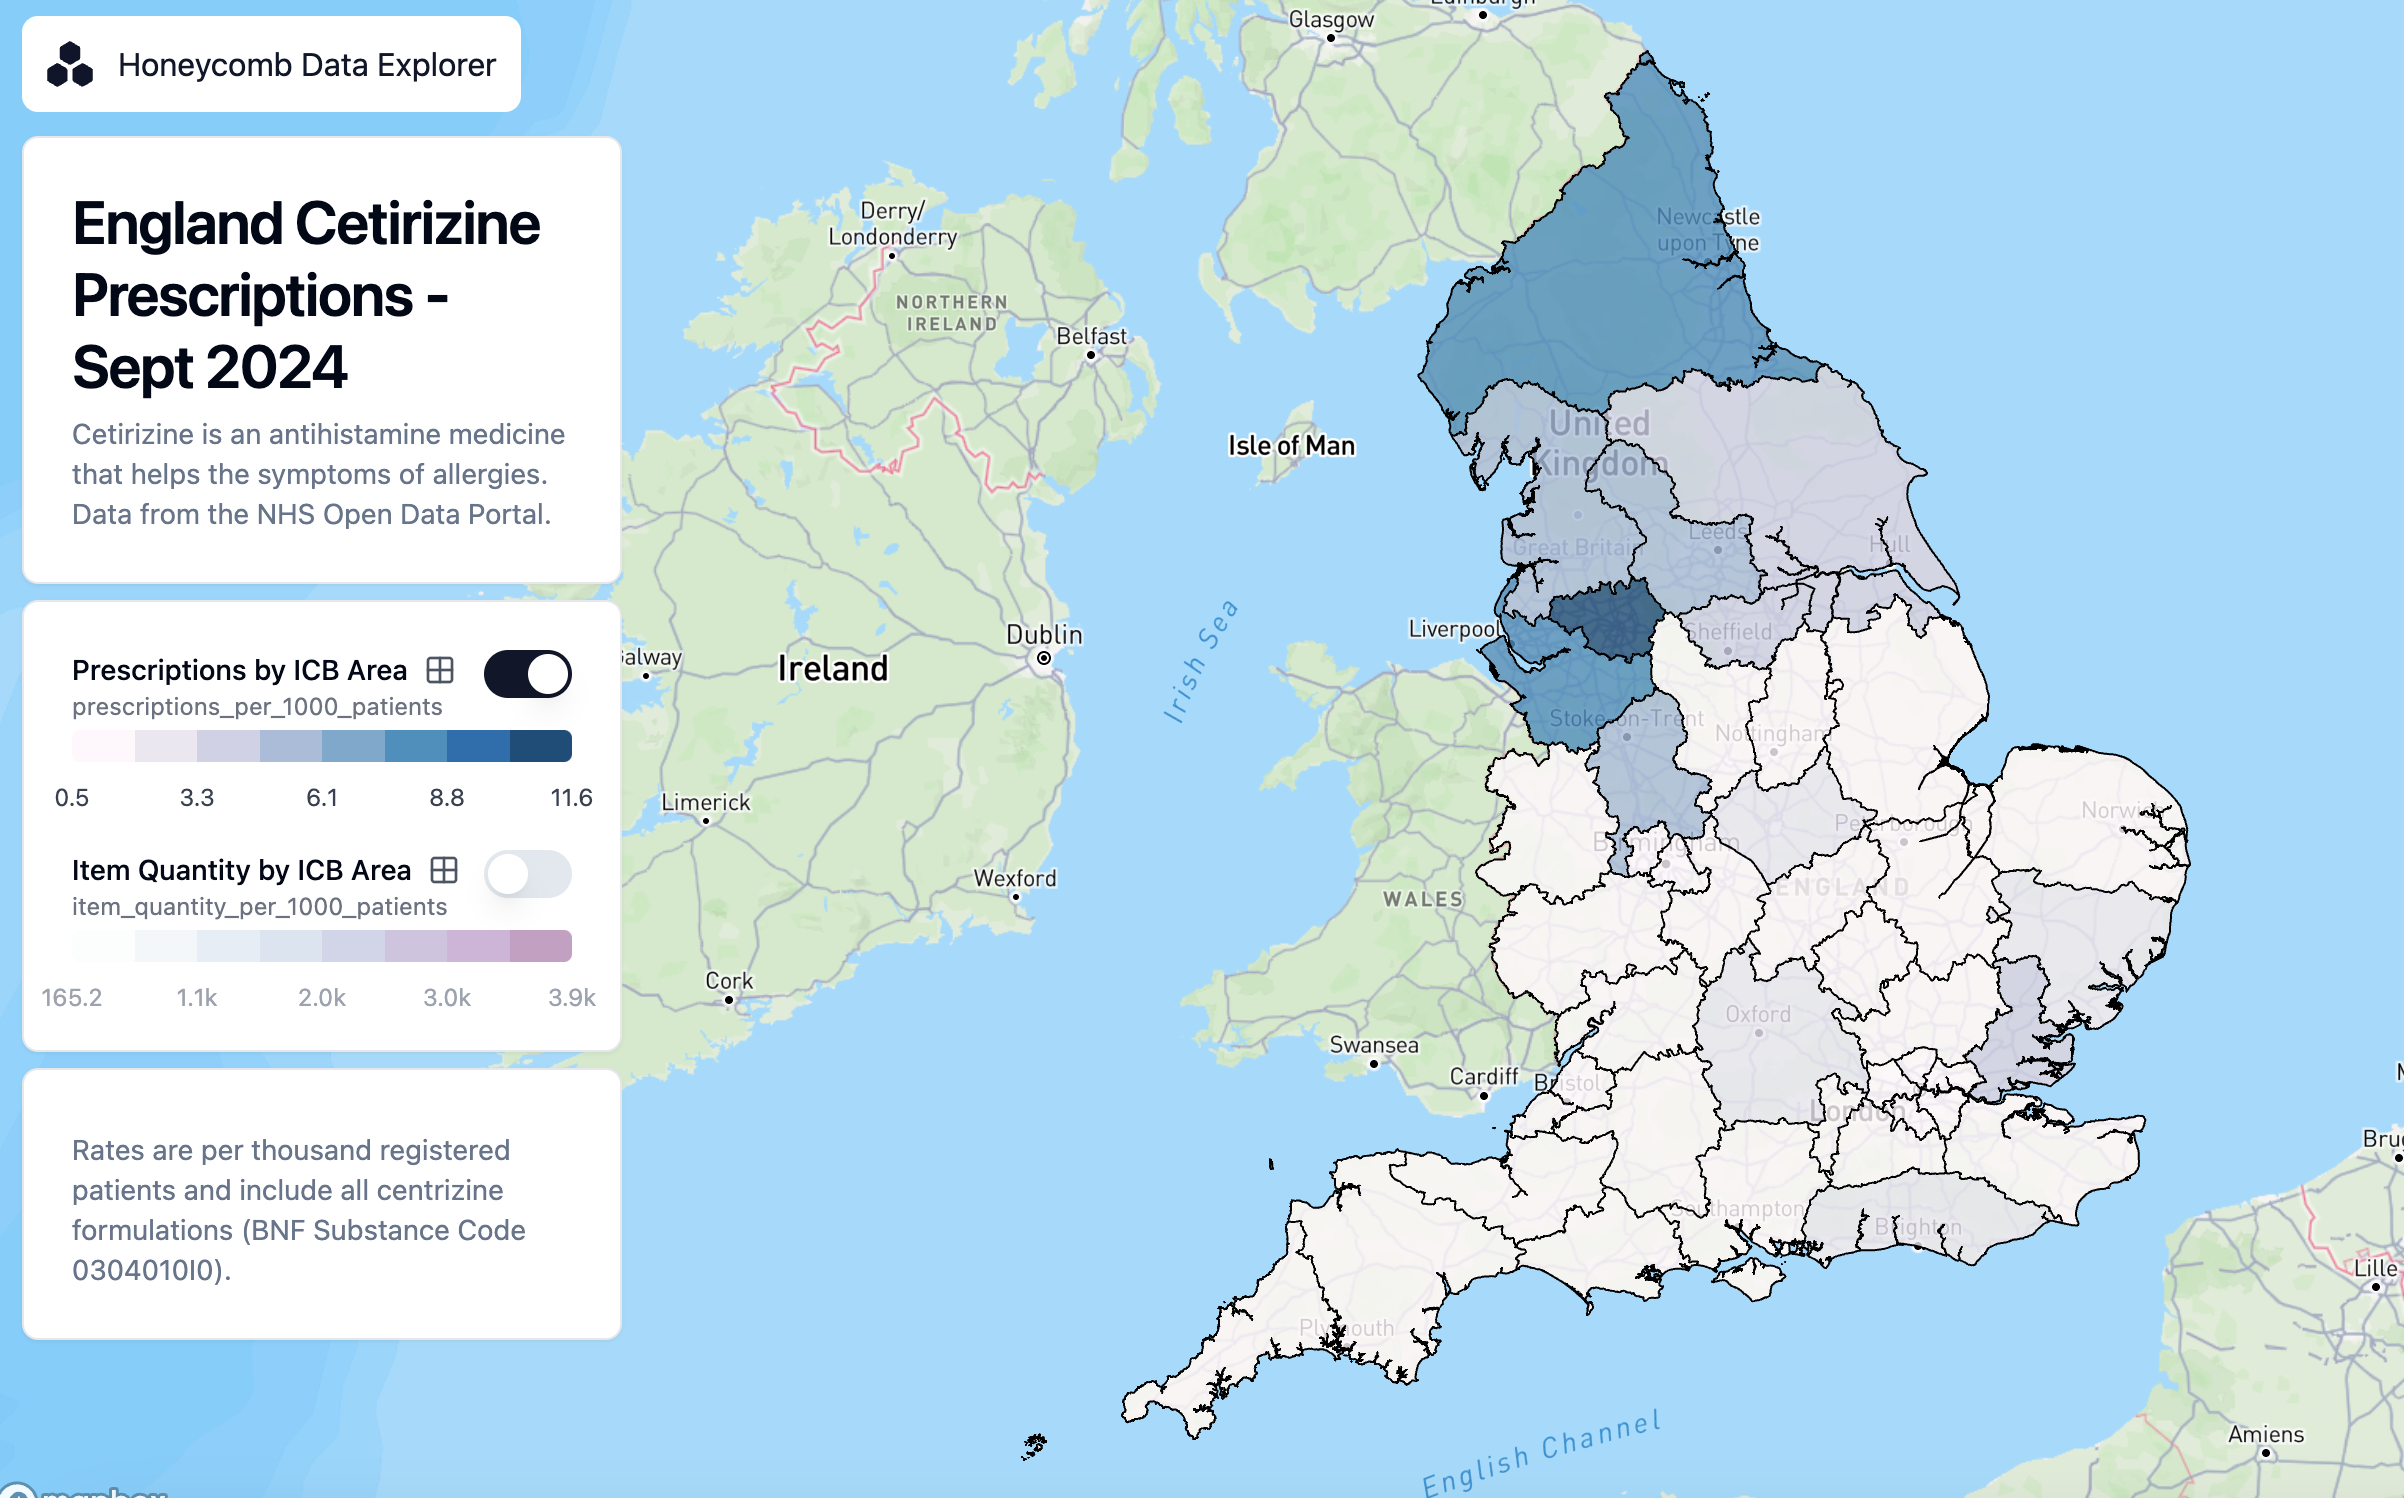
Data-Driven Dynamic Legend
Honeycomb now automatically creates a dynamic legend (key) showing colors and associated values for each layer. Values on the legend update in real-time as users interact with the map and filters, making it easier for users to interpret the data displayed on the map. 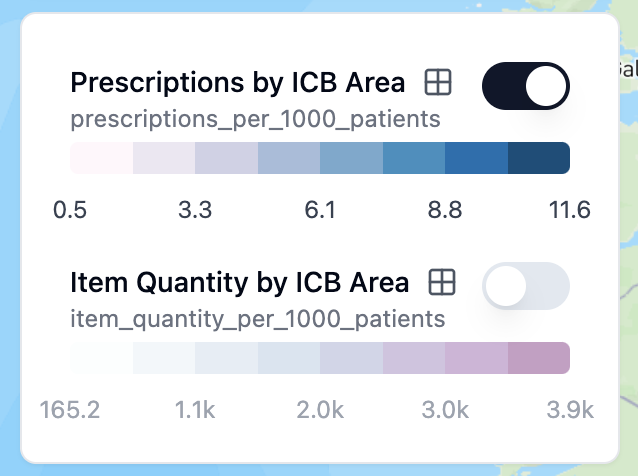
UI Improvements
Options in the 'Edit Map' sidebar are now grouped by category, making specific options easier to find.
Release 11.20.2024
Polygon Layers
Honeycomb now supports importing and displaying polygon data. This enables use cases involving custom boundaries, such as showing the results of elections by county, or displaying the outline of a business area. Columns containing polygons in WKT and GeoJSON format are supported, including data in Snowflake's native GEOMETRY format. Like other layers, polygons support color schemes based on other data fields and customizable tooltips.
Release 11.13.2024
This release adds two key features:
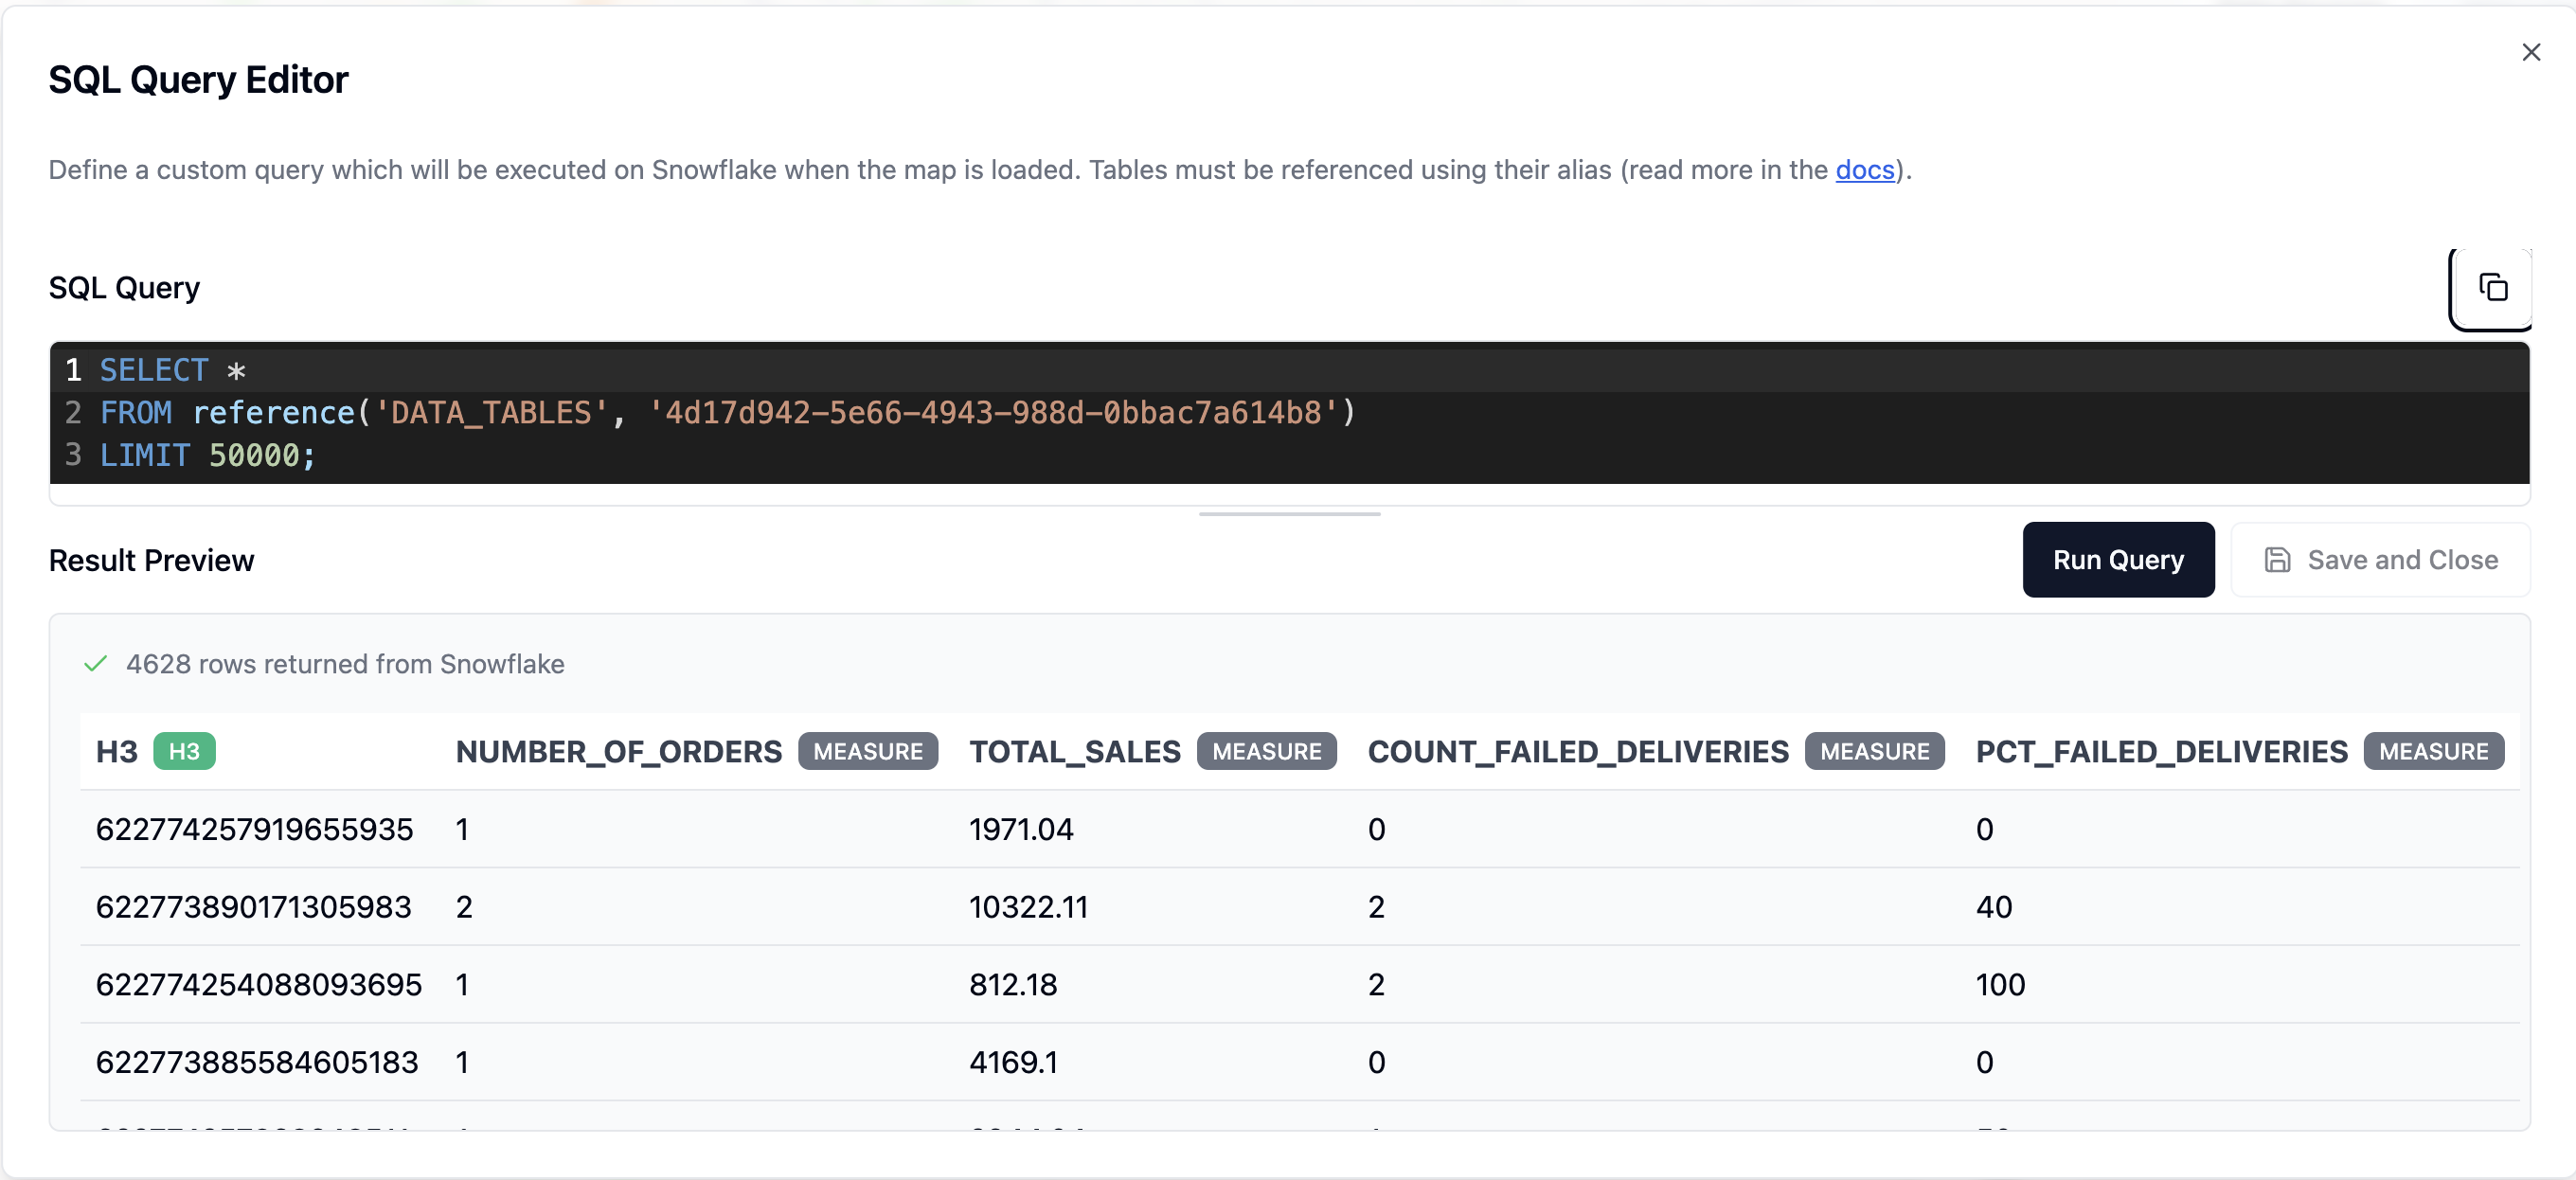
Custom SQL for Snowflake Data Sources
Users can now write a custom SQL statement which will be executed on Snowflake when the map loads. This is useful in situations where companies maintain large fact tables and Honeycomb users who are creating maps would like to only fetch a subset of rows. Read more in the Data Sources Documentation.
Tooltips for Point and H3 Layers
Both Point and H3 (Honeycomb) layers now support tooltips, which show detailed information when a user hovers over them with their mouse. For point layers, the fields displayed on the tooltip is configurable. For H3 (Honeycomb) layers, the tooltip will display the aggregated data value. Read more in the Map Layers Documentation.
Other Improvements:
- This update resolves a bug which caused map layers to toggle to non-visible when the edit map layers menu was opened.
Honeycomb updates are rolled out to Snowflake Native App customers automatically, and there is no action users need to take to upgrade to the latest version.